Personality Prediction Using K-Means Clustering Algorithm and Django Rest Framework (Article Partly Written By GPT3)


Introduction
Artificial Intelligence is revolutionizing the world today as we know it through technical transformations. Machine learning applications are applied in our day-to-day lives, and one of the incredible applications of machine learning is to classify individuals based on their personality traits. Each person on this planet is unique and carries a unique personality. The availability of a high-dimensional and large amount of data has paved the way for increasing marketing campaigns' effectiveness by targeting specific people. Such personality-based communications are highly effective in increasing the popularity and attractiveness of products and services.
In this article, we build a model to predict personality based on 50 questions and deploy the model using Django Rest Framework.
I will also be sharing a snapshot of my code on how I was able to use GPT3 to help me generate content in this article. Every text below, except 'the steps to implement' section, was generated by GPT3, a natural-language processing system that can generate tweets, pens poetry, summarizes emails, answers trivia questions, translates languages and even write its own computer programs.
K-means Clustering Algorithm.
The K-Means clustering algorithm is an algorithm that is used in unsupervised machine learning. To put it simply, it is a clustering algorithm where it groups the data into clusters and then assigns a label to each of the clusters. The K-Means algorithm is an iterative algorithm, it means that it repeats the following steps in a loop until the algorithm is satisfied.
- Assign the input data to K clusters (there are K clusters, the algorithm sorts the data into K clusters)
- Assign each input data to the closest cluster (the algorithm calculates the distance between the data and each of the clusters and then assigns each data to the closest cluster)
- Update the cluster centroids (this is the average of all the data in the cluster)
Applications of K-means Algorithm.
The k-means clustering algorithm is used in a variety of applications. It is used in marketing, advertisement, market segmentation, and customer segmentation. It is also used in various scientific fields, like in determining someones personality.nIn determining someones personality.
Five Personality Traits (OCEAN)
The big five personality traits are:
- Openness to experience
- Conscientiousness
- Extraversion
- Agreeableness
- Neuroticism.
These are the five traits that human behavior is divided into. People can score between 1 and 5 in each of the five traits. For example, let's say that someone scores 3 in openness to experience. This means that he/she is not very open to new experiences, he/she is a person that is very comfortable with their own ways and he/she wants to stick to it. He/she is not very open to new things and he/she tries to avoid it. He/she is a person that doesn't like to try new things. For example, in a party, he/she is not very social and he/she doesn't like to talk a lot. He/she is a person that speaks little and he/she is a person that is not very sociable. In a party, he/she likes to stay at the corner and he/she won't go talk to other people. He/she will just stay and look at other people in the party. This is his/her personality.
Now that we have a basic understanding of the k-means algorithm and the big five personality traits, let us dive deep into building the Big Five personality traits.
Steps to implement.
Let us start by building and saving our model that will be later used to make predictions for our API.
Dataset.
Our dataset consists of 1,015,342 questionnaire answers collected online by Open Psychometrics. Let's look at how the dataset actually appears. The dataset and entire code for this blog can be found on my Github Repo
We first import the necessary dependencies. If you do not have the libraries installed, kindly do so before proceeding.
import numpy as np
import pandas as pd
import matplotlib.pyplot as plt
import seaborn as sns
import os
from sklearn.cluster import KMeans
from yellowbrick.cluster import KElbowVisualizer
from sklearn.preprocessing import MinMaxScaler
from sklearn.decomposition import PCA
import joblib
Next, we load the dataset using pandas and then we display the number of participants:
data_raw = pd.read_csv('data-final.csv', sep='\t')
data = data_raw.copy()
pd.options.display.max_columns = 150

data.drop(data.columns[50:107], axis=1, inplace=True)
data.drop(data.columns[51:], axis=1, inplace=True)

print('Number of participants: ', len(data))
data.head()
Number of participants: 1015341
Exploration of Dataset.
Let us begin by checking for missing values and removing the missing values, like so:
print('Missing value? ', data.isnull().values.any())
print('How many? ', data.isnull().values.sum())
data.dropna(inplace=True)
print('Number of participants after eliminating missing values: ', len(data))
Is there any missing value?  True
How many missing values?  89227
Number of participants after eliminating missing values:  1013481
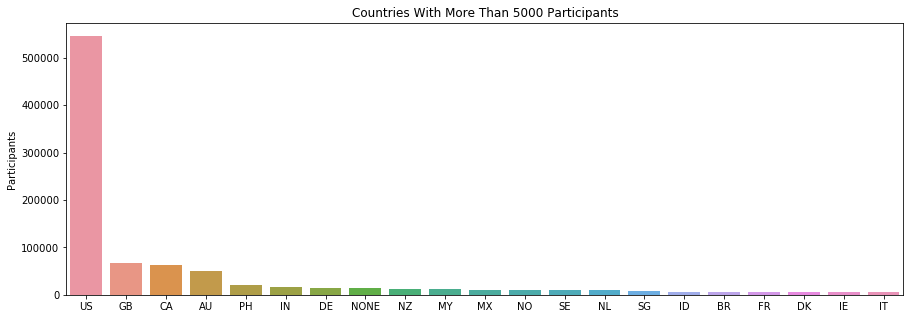
Let us now look at the participant distribution per nationality, by entering the code:
# Participants' nationality distriution
countries = pd.DataFrame(data['country'].value_counts())
countries_5000 = countries[countries['country'] >= 5000]
plt.figure(figsize=(15,5))
sns.barplot(data=countries_5000, x=countries_5000.index, y='country')
plt.title('Countries With More Than 5000 Participants')
plt.ylabel('Participants');
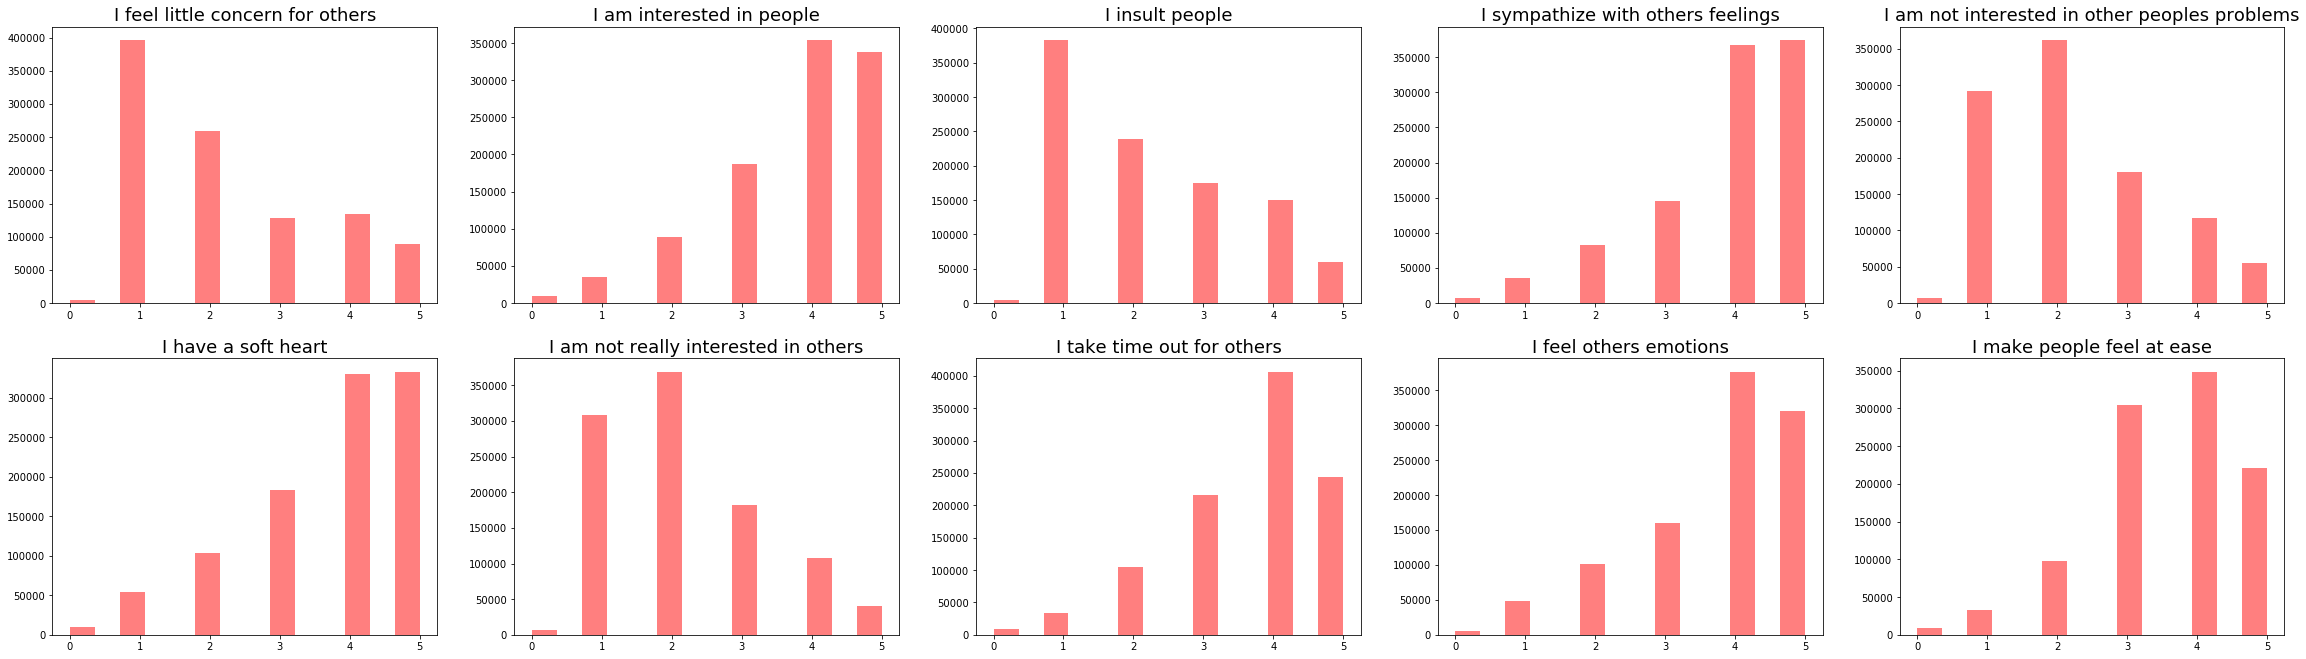
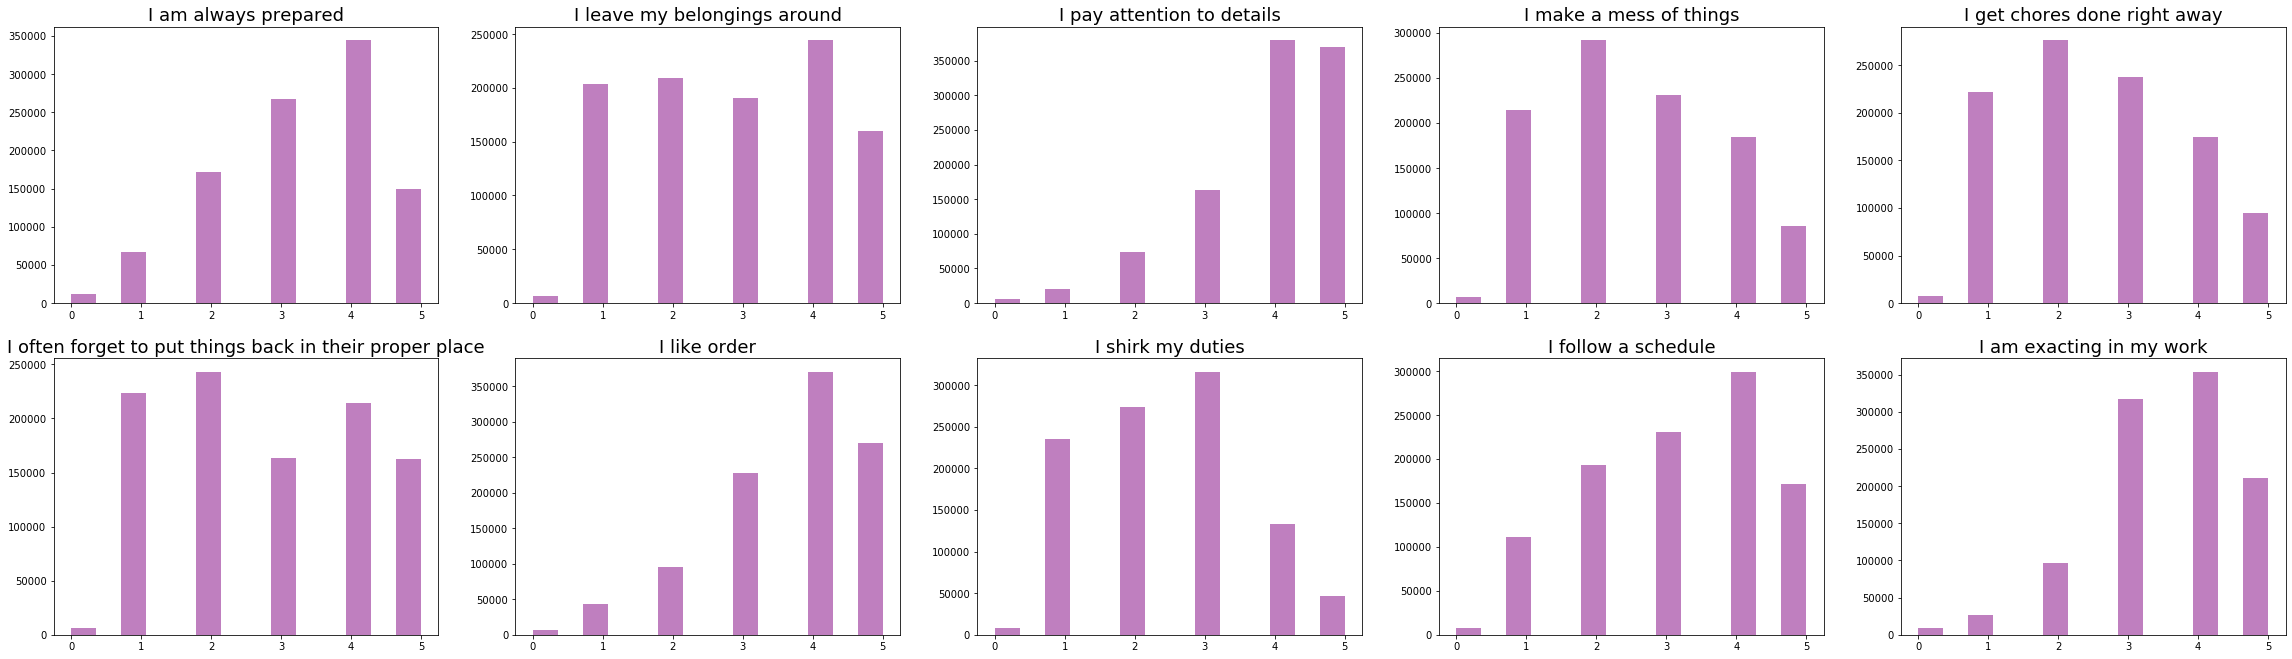
Let us now visualize the question and answer distribution of the questionnaires, like so:
# Defining a function to visualize the questions and answers distribution
def vis_questions(groupname, questions, color):
    plt.figure(figsize=(40,60))
    for i in range(1, 11):
        plt.subplot(10,5,i)
        plt.hist(data[groupname[i-1]], bins=14, color= color, alpha=.5)
        plt.title(questions[groupname[i-1]], fontsize=18)
Q&As Related to Extroversion Personality
print('Q&As Related to Extroversion Personality')
vis_questions(EXT, ext_questions, 'orange')

Q&As Related to Neuroticism Personality
print('Q&As Related to Neuroticism Personality')
vis_questions(EST, est_questions, 'pink')

Q&As Related to Agreeable Personality
print('Q&As Related to Agreeable Personality')
vis_questions(AGR, agr_questions, 'red')
Q&As Related to Conscientious Personality
print('Q&As Related to Conscientious Personality')
vis_questions(CSN, csn_questions, 'purple')
Q&As Related to Open Personality
print('Q&As Related to Open Personality')
vis_questions(OPN, opn_questions, 'blue')

Building the Model
We already know the number of clusters that will be present in our model, that is 5, the big five of personality traits. Let us see how we can get this value using code. For ease of calculation, we shall scale all the values between 0-1 and use only a sample of 5000, like so:
df = data.drop('country', axis=1)
columns = list(df.columns)

scaler = MinMaxScaler(feature_range=(0,1))
df = scaler.fit_transform(df)
df = pd.DataFrame(df, columns=columns)
df_sample = df[:5000]
Let us now visualize our elbow curve. In cluster analysis, the elbow method is a heuristic used in determining the number of clusters in a data set. The method consists of plotting the explained variation as a function of the number of clusters, and picking the elbow of the curve as the number of clusters to use.
kmeans = KMeans()
visualizer = KElbowVisualizer(kmeans, k=(2,15))
visualizer.fit(df_sample)
visualizer.poof()
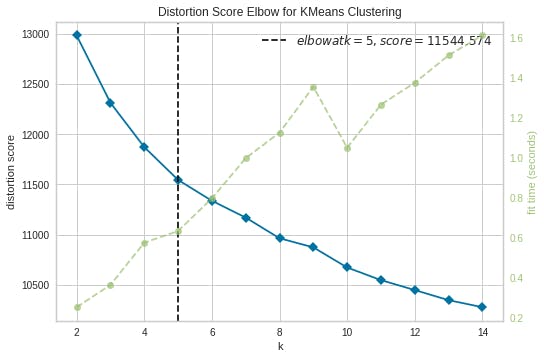
As you can see 5 clusters looks optimum for the data set and we already know this researh is to identify 5 different personalities.
Clustering Participants into 5 Personality Groups
To do this, we use the unscaled data but without the country column.
df_model = data.drop('country', axis=1)

# I define 5 clusters and fit my model
kmeans = KMeans(n_clusters=5)
k_fit = kmeans.fit(df_model)
## SAVE KFIT MODEL
joblib_file = "BigFivePersonalityTestModel.joblib"
joblib.dump(k_fit, joblib_file)

# Predicting the Clusters
pd.options.display.max_columns = 10
predictions = k_fit.labels_
df_model['Clusters'] = predictions
df_model.head()
EXT1    EXT2    EXT3    EXT4    EXT5    ...    OPN7    OPN8    OPN9    OPN10    Clusters
0    4.0    1.0    5.0    2.0    5.0    ...    5.0    3.0    4.0    5.0    3
1    3.0    5.0    3.0    4.0    3.0    ...    4.0    2.0    5.0    3.0    2
2    2.0    3.0    4.0    4.0    3.0    ...    5.0    3.0    4.0    4.0    2
3    2.0    2.0    2.0    3.0    4.0    ...    4.0    4.0    3.0    3.0    1
4    3.0    3.0    3.0    3.0    5.0    ...    5.0    3.0    5.0    5.0    3
Analysing the Model and Predictions
Let us see how many individuals we have for each cluster, like so:
df_model.Clusters.value_counts()
4    227063
2    212816
3    210075
0    200226
1    163301
Name: Clusters, dtype: int64
Let's group the results acording to clusters. That way we can investigate the average answer to the each question for each cluster.
That way we can have an intuition about how our model classifies people.
pd.options.display.max_columns = 150
df_model.groupby('Clusters').mean()
Let's now sum up the each question groups (EXT, EST ..) and see if we can see a pattern.
# Summing up the different questions groups
col_list = list(df_model)
ext = col_list[0:10]
est = col_list[10:20]
agr = col_list[20:30]
csn = col_list[30:40]
opn = col_list[40:50]

data_sums = pd.DataFrame()
data_sums['extroversion'] = df_model[ext].sum(axis=1)/10
data_sums['neurotic'] = df_model[est].sum(axis=1)/10
data_sums['agreeable'] = df_model[agr].sum(axis=1)/10
data_sums['conscientious'] = df_model[csn].sum(axis=1)/10
data_sums['open'] = df_model[opn].sum(axis=1)/10
data_sums['clusters'] = predictions
data_sums.groupby('clusters').mean()
extroversion    neurotic    agreeable    conscientious    open
clusters
0    2.965969    3.645931    3.148628    3.173210    3.245529
1    2.909467    2.525743    2.851802    2.914458    3.120373
2    3.051889    2.984940    3.187544    3.159140    3.243641
3    3.085431    2.423577    3.209064    3.106899    3.327173
4    3.072319    3.426610    3.300147    3.211454    3.352370
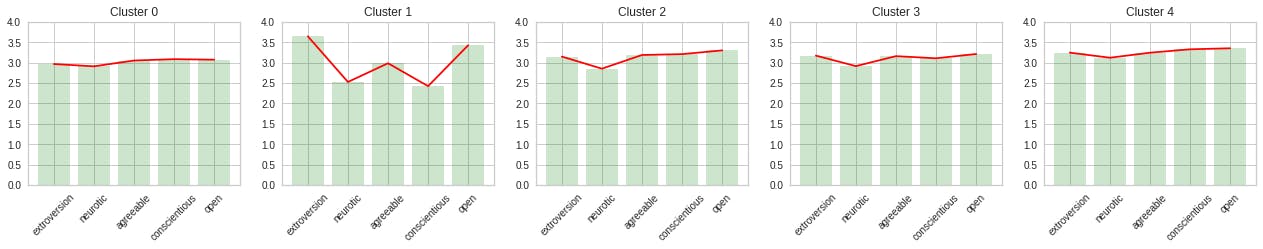
Let us now visualize the mean for each of our 5 personality clusters:
# Visualizing the means for each cluster
dataclusters = data_sums.groupby('clusters').mean()
plt.figure(figsize=(22,3))
for i in range(0, 5):
    plt.subplot(1,5,i+1)
    plt.bar(dataclusters.columns, dataclusters.iloc[:, i], color='green', alpha=0.2)
    plt.plot(dataclusters.columns, dataclusters.iloc[:, i], color='red')
    plt.title('Cluster ' + str(i))
    plt.xticks(rotation=45)
    plt.ylim(0,4);
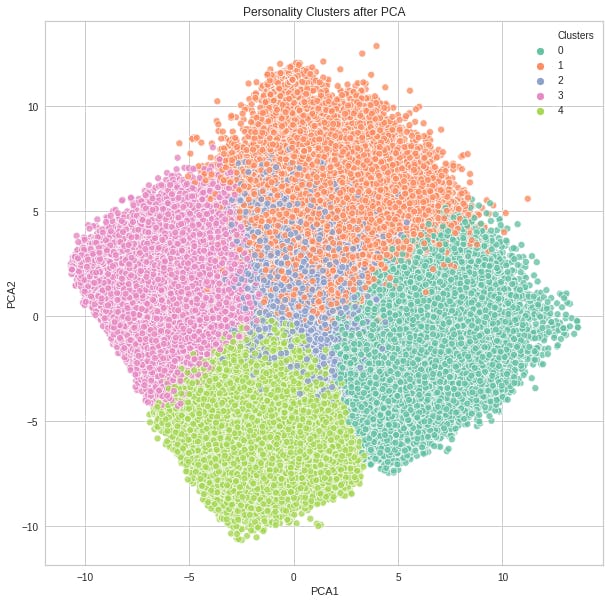
Visualizing the Cluster Predictions
pca = PCA(n_components=2)
pca_fit = pca.fit_transform(df_model)

df_pca = pd.DataFrame(data=pca_fit, columns=['PCA1', 'PCA2'])
df_pca['Clusters'] = predictions
df_pca.head()
plt.figure(figsize=(10,10))
sns.scatterplot(data=df_pca, x='PCA1', y='PCA2', hue='Clusters', palette='Set2', alpha=0.8)
plt.title('Personality Clusters after PCA');
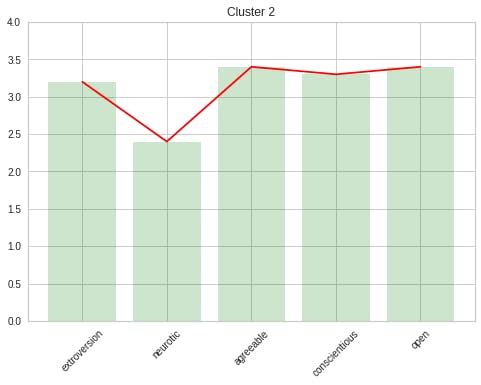
Predict Personality
I answered the questions in an Microsoft Excel spread sheet. Then I added that data into this notebook and put my answers to the model to see in which category I will be.
my_data = pd.read_excel('my_personality_test.xlsx')
my_personality = k_fit.predict(my_data)
print('My Personality Cluster: ', my_personality)
My Personality Cluster: [2]
Visualizing my personality cluster
col_list = list(my_data)
ext = col_list[0:10]
est = col_list[10:20]
agr = col_list[20:30]
csn = col_list[30:40]
opn = col_list[40:50]

my_sums = pd.DataFrame()
my_sums['extroversion'] = my_data[ext].sum(axis=1)/10
my_sums['neurotic'] = my_data[est].sum(axis=1)/10
my_sums['agreeable'] = my_data[agr].sum(axis=1)/10
my_sums['conscientious'] = my_data[csn].sum(axis=1)/10
my_sums['open'] = my_data[opn].sum(axis=1)/10
my_sums['cluster'] = my_personality
print('Sum of my question groups')
my_sums
my_sum = my_sums.drop('cluster', axis=1)
plt.bar(my_sum.columns, my_sum.iloc[0,:], color='green', alpha=0.2)
plt.plot(my_sum.columns, my_sum.iloc[0,:], color='red')
plt.title('Cluster 2')
plt.xticks(rotation=45)
plt.ylim(0,4);
Now that our model works, let us proceed by turning our model into a Restful API
Turning the Model into an RESTFUL API
Following Python best practices, we will create a virtual environment for our project, and install the required packages.
First, create the project directory.
$ mkdir djangoapp
$ cd djangoapp
Now, create a virtual environment and install the required packages.
For macOS and Unix systems:
$ python3 -m venv myenv
$ source myenv/bin/activate
(myenv) $ pip install django requests numpy joblib scikit-learn xlsxwriter openpyxl
For Windows:
$ python3 -m venv myenv
$ myenv\Scripts\activate
(myenv) $ pip install django requests numpy joblib scikit-learn xlsxwriter openpyxl
Setting Up Your Django Application
First, navigate to the directory djangoapp we created and establish a Django project.
(myenv) $ django-admin startproject mainapp
This will auto-generate some files for your project skeleton:
mainapp/
    manage.py
    mainapp/
        __init__.py
        settings.py
        urls.py
        asgi.py
        wsgi.py
Now, navigate to the directory you just created (make sure you are in the same directory as manage.py) and create your app directory.
(myenv) $ python manage.py startapp monitor
This will create the following:
monitor/
    __init__.py
    admin.py
    apps.py
    migrations/
        __init__.py
    models.py
    tests.py
    views.py
On the mainapp/settings.py file, look for the following line and add the app we just created above.
INSTALLED_APPS = [
    'django.contrib.admin',
    'django.contrib.auth',
    'django.contrib.contenttypes',
    'django.contrib.sessions',
    'django.contrib.messages',
    'django.contrib.staticfiles',
    'monitor', #new line
]
Ensure you are in the monitor directory then create a new directory called templates then a new file called urls.py. Your directory structure of monitor application should look like this
monitor/
    __init__.py
    admin.py
    apps.py
    migrations/
    templates/
        __init__.py
    models.py
    tests.py
    urls.py
    views.py
Ensure your mainapp/urls.py file, add our monitor app URL to include the URLs we shall create next on the monitor app:
from django.contrib import admin
from django.urls import path, include

urlpatterns = [
    #path('admin/', admin.site.urls),
    path('', include('monitor.urls')),#monitor app url
]
Now, on the monitor/urls.py file, add our website there:
from django.urls import path
from .views import *

urlpatterns = [
    path('persona', PersonalityPrediction.as_view(), name='personality'),
]
Let’s create another directory to store our machine learning model. I’ll also add the dataset to the project for those who want to achieve the whole dataset. (It is not compulsory to create a data folder.) Be sure to move the vectorizer file and the joblib file we created earlier to ml/model folder
(venv)$ mkdir ml
(venv)$ mkdir ml/models
(venv)$ mkdir ml/data
We also need to tell Django where our machine learning model is located. Add these lines to settings.py file:
import os
MODELS = os.path.join(BASE_DIR, 'ml/models')
Load Model and Vectorizer through apps.py
Load the model we created and saved in apps.py so that when the application starts, the trained model is loaded only once. Otherwise, the trained model is loaded each time an endpoint is called, and then the response time will be slower.
Let’s update apps.py
import os
import joblib
from django.apps import AppConfig
from django.conf import settings


class ApiConfig(AppConfig):
    name = 'api'
    MODEL_FILE = os.path.join(settings.MODELS, "BigFivePersonalityTestModel.joblib")
    model = joblib.load(MODEL_FILE)
Edit views.py
The views will be mainly responsible for:
- Process incoming POST requests.
from django.shortcuts import render
from rest_framework.views import APIView
from rest_framework.response import Response
import requests
from .apps import *
import pandas as pd
import xlsxwriter

#kmeans personality prediction view
class PersonalityPrediction(APIView):
    def post(self, request):
        #get user input
        EXT1 = request.data.get('EXT1')
        EXT2 = request.data.get('EXT2')
        EXT3 = request.data.get('EXT3')
        EXT4 = request.data.get('EXT4')
        EXT5 = request.data.get('EXT5')
        EXT6 = request.data.get('EXT6')
        EXT7 = request.data.get('EXT7')
        EXT8 = request.data.get('EXT8')
        EXT9 = request.data.get('EXT9')
        EXT10 = request.data.get('EXT10')

        EST1 = request.data.get('EST1')
        EST2 = request.data.get('EST2')
        EST3 = request.data.get('EST3')
        EST4 = request.data.get('EST4')
        EST5 = request.data.get('EST5')
        EST6 = request.data.get('EST6')
        EST7 = request.data.get('EST7')
        EST8 = request.data.get('EST8')
        EST9 = request.data.get('EST9')
        EST10 = request.data.get('EST10')

        AGR1 = request.data.get('AGR1')
        AGR2 = request.data.get('AGR2')
        AGR3 = request.data.get('AGR3')
        AGR4 = request.data.get('AGR4')
        AGR5 = request.data.get('AGR5')
        AGR6 = request.data.get('AGR6')
        AGR7 = request.data.get('AGR7')
        AGR8 = request.data.get('AGR8')
        AGR9 = request.data.get('AGR9')
        AGR10 = request.data.get('AGR10')

        CSN1 = request.data.get('CSN1')
        CSN2 = request.data.get('CSN2')
        CSN3 = request.data.get('CSN3')
        CSN4 = request.data.get('CSN4')
        CSN5 = request.data.get('CSN5')
        CSN6 = request.data.get('CSN6')
        CSN7 = request.data.get('CSN7')
        CSN8 = request.data.get('CSN8')
        CSN9 = request.data.get('CSN9')
        CSN10 = request.data.get('CSN10')

        OPN1 = request.data.get('OPN1')
        OPN2 = request.data.get('OPN2')
        OPN3 = request.data.get('OPN3')
        OPN4 = request.data.get('OPN4')
        OPN5 = request.data.get('OPN5')
        OPN6 = request.data.get('OPN6')
        OPN7 = request.data.get('OPN7')
        OPN8 = request.data.get('OPN8')
        OPN9 = request.data.get('OPN9')
        OPN10 = request.data.get('OPN10')
        #load model
        kmeansModel = PersonalityTestConfig.model
        # Predicting the Clusters
        pd.options.display.max_columns = 10
        predictions = kmeansModel.labels_

        workbook = xlsxwriter.Workbook('hello.xlsx')

        worksheet = workbook.add_worksheet()

        worksheet.write('A1', 'EXT1')
        worksheet.write('A2', (EXT1))

        worksheet.write('B1', 'EXT2')
        worksheet.write('B2', (EXT2))

        worksheet.write('C1', 'EXT3')
        worksheet.write('C2', (EXT3))

        worksheet.write('D1', 'EXT4')
        worksheet.write('D2', (EXT4))

        worksheet.write('E1', 'EXT5')
        worksheet.write('E2', (EXT5))

        worksheet.write('F1', 'EXT6')
        worksheet.write('F2', (EXT6))

        worksheet.write('G1', 'EXT7')
        worksheet.write('G2', (EXT7))

        worksheet.write('H1', 'EXT8')
        worksheet.write('H2', (EXT8))

        worksheet.write('I1', 'EXT9')
        worksheet.write('I2', (EXT9))

        worksheet.write('J1', 'EXT10')
        worksheet.write('J2', (EXT10))

        worksheet.write('K1', 'EST1')
        worksheet.write('K2', (EST1))

        worksheet.write('L1', 'EST2')
        worksheet.write('L2', (EST2))

        worksheet.write('M1', 'EST3')
        worksheet.write('M2', (EST3))

        worksheet.write('N1', 'EST4')
        worksheet.write('N2', (EST4))

        worksheet.write('O1', 'EST5')
        worksheet.write('O2', (EST5))

        worksheet.write('P1', 'EST6')
        worksheet.write('P2', (EST6))

        worksheet.write('Q1', 'EST7')
        worksheet.write('Q2', (EST7))

        worksheet.write('R1', 'EST8')
        worksheet.write('R2', (EST8))

        worksheet.write('S1', 'EST9')
        worksheet.write('S2', (EST9))

        worksheet.write('T1', 'EST10')
        worksheet.write('T2', (EST10))

        worksheet.write('U1', 'AGR1')
        worksheet.write('U2', (AGR1))

        worksheet.write('V1', 'AGR2')
        worksheet.write('V2', (AGR2))

        worksheet.write('W1', 'AGR3')
        worksheet.write('W2', (AGR3))

        worksheet.write('X1', 'AGR4')
        worksheet.write('X2', (AGR4))

        worksheet.write('Y1', 'AGR5')
        worksheet.write('Y2', (AGR5))

        worksheet.write('Z1', 'AGR6')
        worksheet.write('Z2', (AGR6))

        worksheet.write('AA1', 'AGR7')
        worksheet.write('AA2', (AGR7))

        worksheet.write('AB1', 'AGR8')
        worksheet.write('AB2', (AGR8))

        worksheet.write('AC1', 'AGR9')
        worksheet.write('AC2', (AGR9))

        worksheet.write('AD1', 'AGR10')
        worksheet.write('AD2', (AGR10))


        worksheet.write('AE1', 'CSN1')
        worksheet.write('AE2', (CSN1))

        worksheet.write('AF1', 'CSN2')
        worksheet.write('AF2', (CSN2))

        worksheet.write('AG1', 'CSN3')
        worksheet.write('AG2', (CSN3))

        worksheet.write('AH1', 'CSN4')
        worksheet.write('AH2', (CSN4))

        worksheet.write('AI1', 'CSN5')
        worksheet.write('AI2', (CSN5))

        worksheet.write('AJ1', 'CSN6')
        worksheet.write('AJ2', (CSN6))

        worksheet.write('AK1', 'CSN7')
        worksheet.write('AK2', (CSN7))

        worksheet.write('AL1', 'CSN8')
        worksheet.write('AL2', (CSN8))

        worksheet.write('AM1', 'CSN9')
        worksheet.write('AM2', (CSN9))

        worksheet.write('AN1', 'CSN10')
        worksheet.write('AN2', (CSN10))


        worksheet.write('AO1', 'OPN1')
        worksheet.write('AO2', (OPN1))

        worksheet.write('AP1', 'OPN2')
        worksheet.write('AP2', (OPN2))

        worksheet.write('AQ1', 'OPN3')
        worksheet.write('AQ2', (OPN3))

        worksheet.write('AR1', 'OPN4')
        worksheet.write('AR2', (OPN4))

        worksheet.write('AS1', 'OPN5')
        worksheet.write('AS2', (OPN5))

        worksheet.write('AT1', 'OPN6')
        worksheet.write('AT2', (OPN6))

        worksheet.write('AU1', 'OPN7')
        worksheet.write('AU2', (OPN7))

        worksheet.write('AV1', 'OPN8')
        worksheet.write('AV2', (OPN8))

        worksheet.write('AW1', 'OPN9')
        worksheet.write('AW2', (OPN9))

        worksheet.write('AX1', 'OPN10')
        worksheet.write('AX2', (OPN10))


        # Finally, close the Excel file
        # via the close() method.
        workbook.close()

        my_data = pd.read_excel('hello.xlsx', engine='openpyxl')

        my_personality = kmeansModel.predict(my_data)
        print('My Personality Cluster: ', my_personality)

        # Summing up the my question groups
        col_list = list(my_data)
        ext = col_list[0:10]
        est = col_list[10:20]
        agr = col_list[20:30]
        csn = col_list[30:40]
        opn = col_list[40:50]

        my_sums = pd.DataFrame()
        my_sums['extroversion'] = my_data[ext].sum(axis=1)/10
        my_sums['neurotic'] = my_data[est].sum(axis=1)/10
        my_sums['agreeable'] = my_data[agr].sum(axis=1)/10
        my_sums['conscientious'] = my_data[csn].sum(axis=1)/10
        my_sums['open'] = my_data[opn].sum(axis=1)/10
        my_sums['cluster'] = my_personality
        print('Sum of my question groups')
        print(my_sums)

        response_dict = {"Prediction": my_sums}
        print(response_dict)
        return Response(response_dict, status=200)
The code above starts by getting the data appended to the request body. The code then creates a new excel file programmatically which is used in the prediction and returns the cluster as a response.
Testing our model.
To test the system, make the necessary migrations and run the django server. Open POSTMAN and make a POST request to our server like so, with the answers to the questionnaire appended to the body of the request. We should get a sample response showing us our personality cluster and our scores. To test my live system, make a POST request to the URL below:
https://alienx.tech/api/v1/persona
The code below is what i used to prompt GPT3 to help me generate the content in this blog:
import openai
openai.api_key = "VISIT OPENAI TO GET YOUR KEY"
response = openai.Completion.create(
  engine="davinci",
  prompt="The Pixel District Janury 16, 2022n Title: Personality Segmentation Using K-Means Clustering Algorithm and Django Rest Framework!n tags: machine-learning, kmeans, gpt3, kmeans code sample Summary:  I am sharing my exprience in implementing kmeans clustering algorithmn in determining someones personality. I am explaining why kmeans clustering algorithms is, how it works configuration. I am explaining what the big five personality traits are. I am explaining why I think kmeans algorithm is the best to use in finding someones personality based on the  big five personality traits. I am also adding various example codes of the kmeans clustering to find the big five personality traits.n Full text: ",
  temperature=0.7,
  max_tokens=1655,
  top_p=1,
  frequency_penalty=0,
  presence_penalty=0
)
print(response)
That's it for today. Thanks for staying tuned in!